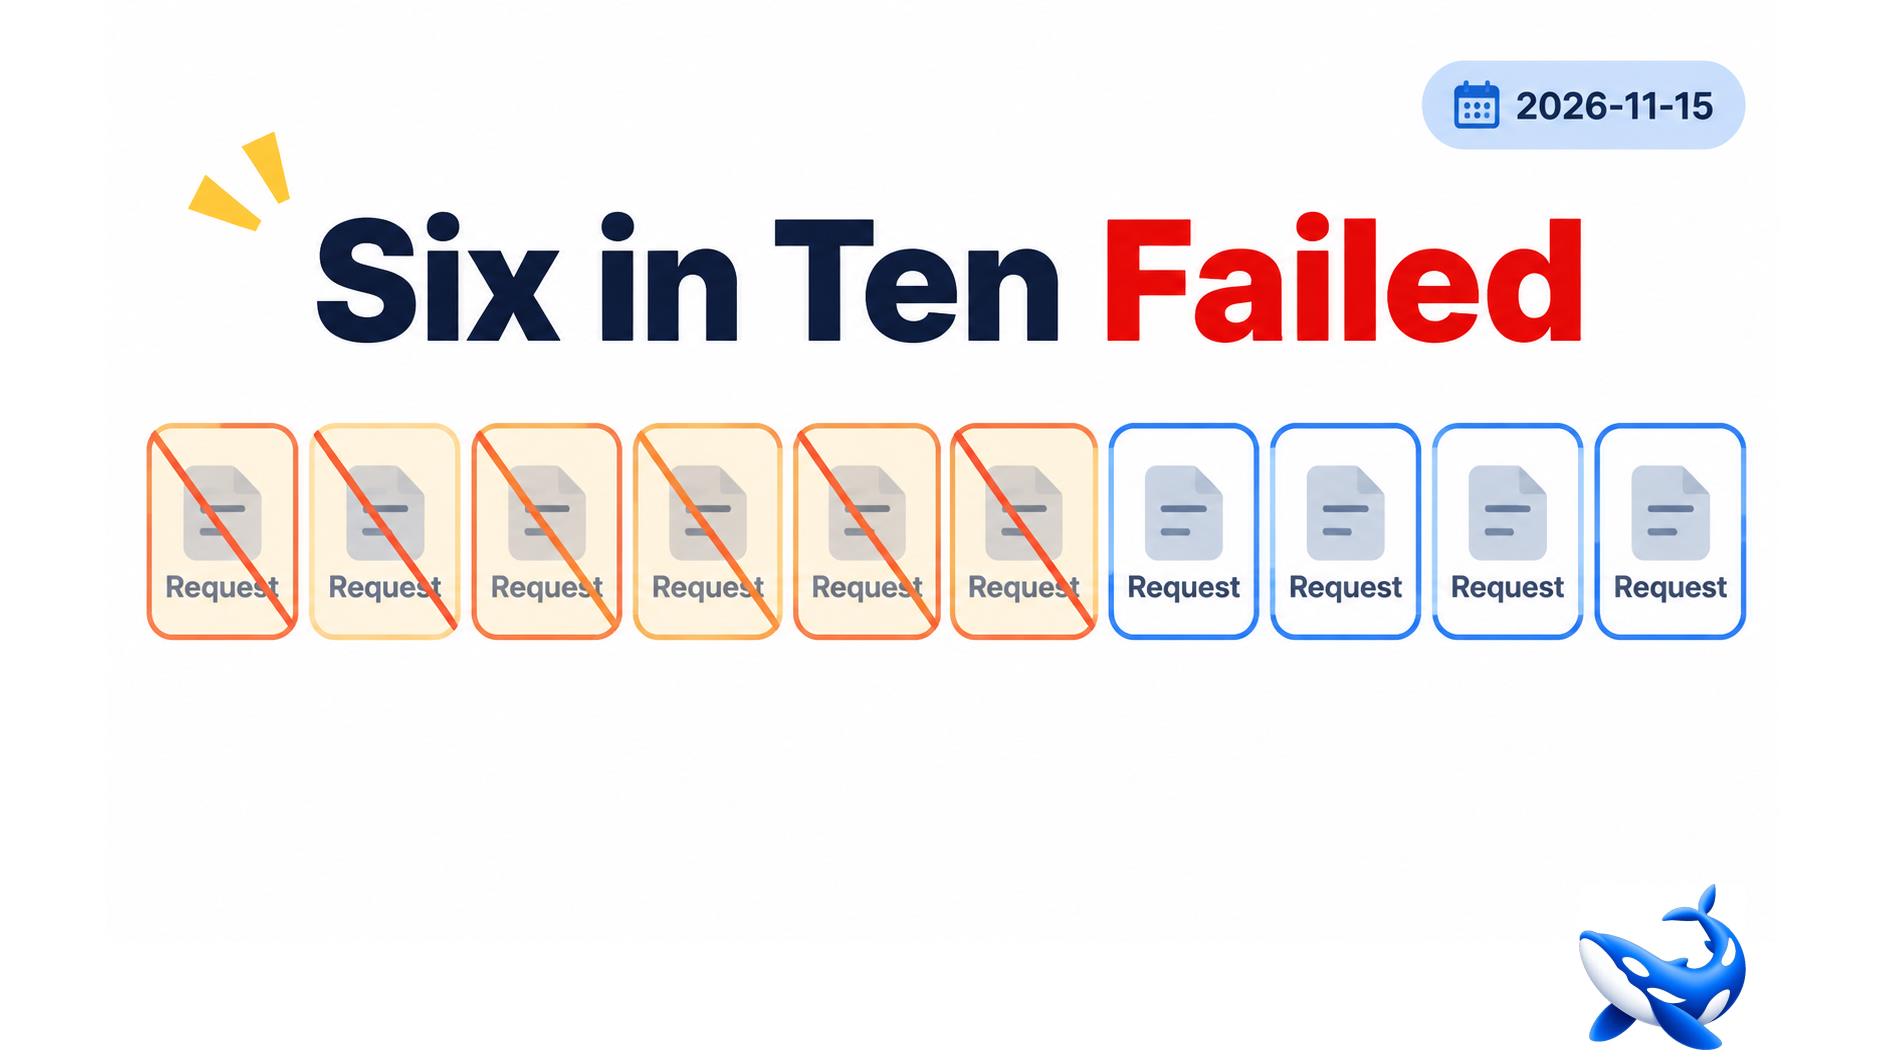
On OrcaRouter‘s cyber tier, the base `mimo-v2.6-flash` checkpoint returns an error on 60.595% of requests. MiMo V2.6 Flash abliterated returns one on 0.938% [OURS].
Six in ten against one in a hundred is a 64.6-fold difference, and it is not a quality comparison. It is the difference between an endpoint that is working and one that was mostly down for the week.
That distinction matters because the base is the card most teams evaluate first — it is cheaper, it is documented by the lab, and its price is $0.14/$0.28 against the card’s $0.80/$1.60 [OURS]. Reading 60.595% as a quality signal rather than an availability signal would lead to the wrong conclusion in both directions.
The two rows
| row | base | abliterated card |
| error rate | 60.595% | 0.938% |
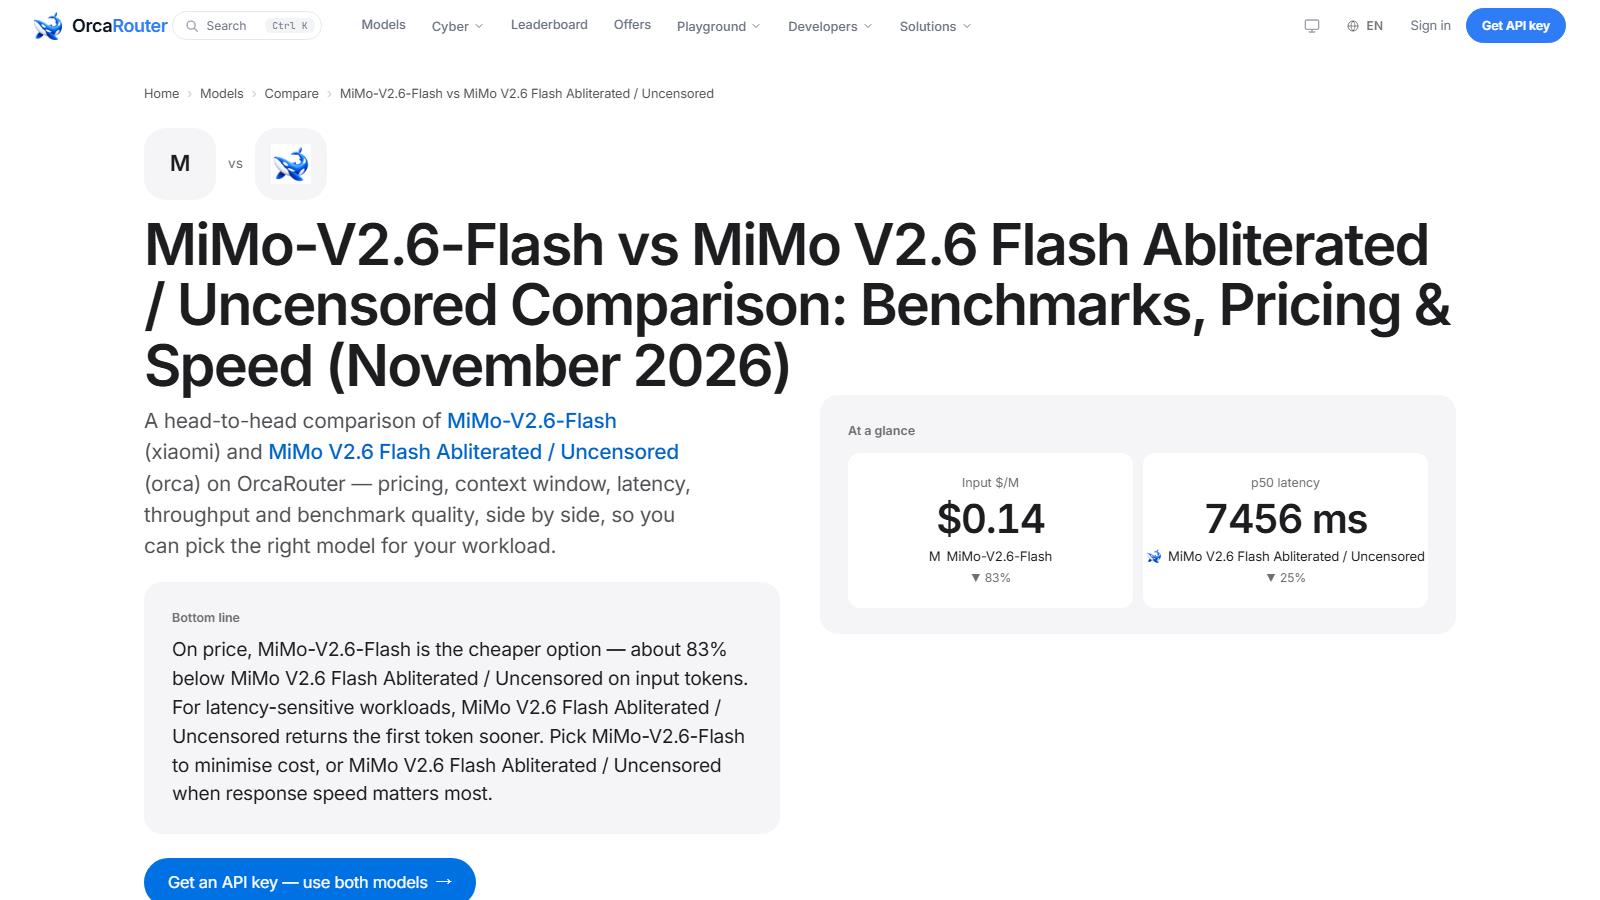
| p50 first token | 10,000 ms (cap) | 7,459 ms |
| p95 first token | 10,000 ms (cap) | 10,000 ms (cap) |
| output speed | 92.0 tok/s | 42.2 tok/s |
| traffic 7d | 0.14B | 0.46B |
| context | 1,048,576 | 1,048,576 |
| output ceiling | 131,072 | 131,072 |
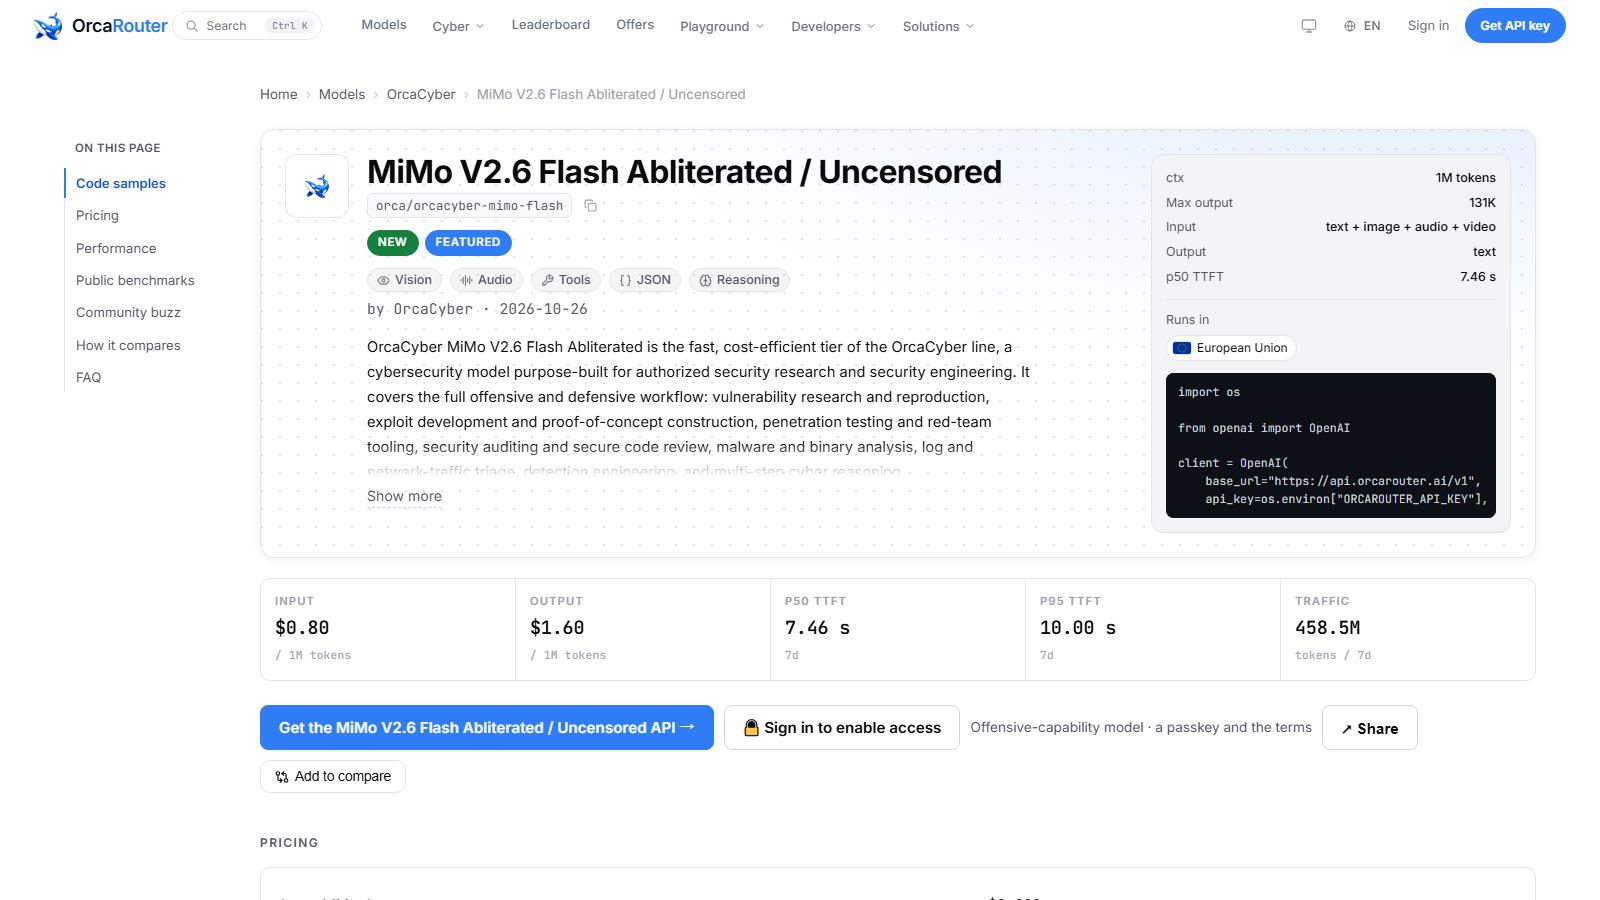
| input price | $0.14 | $0.80 |
| output price | $0.28 | $1.60 |
Three of these rows are the reporting cap doing the talking. A 10,000 ms median with a 10,000 ms p95 is not a latency distribution; it is a distribution with nothing below the ceiling, which happens when most requests never complete.
The traffic row is the one that makes the case: the card carries 3.37× the base’s volume. On seven of the eight abliterated pairs the card is the quieter endpoint. MiMo is the exception, and the error rate explains it.
What 60.595% means in practice
A team that evaluated the base first would have seen two failures in three requests and concluded the family was unusable.
That is roughly what happened. The base carries 0.14 billion tokens a week — the lowest traffic of any card or checkpoint in the entire dataset, thirteen times below the next quietest [OURS]. If an endpoint fails six requests in ten, teams do not queue work against it; they route elsewhere and stop retrying.
The card at 0.938% carries 0.46 billion, which is still the second-lowest card traffic on the tier but three times the base. So the traffic followed the reliability, not the price. A card at 5.7× the input rate is being chosen over its own base, which only happens when the cheaper one does not work.
Why the base is not a fallback
The usual pattern on this tier is that a base checkpoint is the default — cheaper, better documented, more traffic — and the abliterated card is the specialised option for work that needs refusal removed.
MiMo inverts that. Its base is a worse endpoint on every serving row, and its card is the one with the traffic and the working latency.
Three explanations, and the data supports the third most strongly.
The base was under-provisioned. Possible, and it would show as a slowly improving trend rather than a flat week at the cap. The daily medians are 9,575, 10,000, 9,613, 10,000, 10,000, 6,490 and 6,356 — the last two days are better, so there is some of this.
The base was deprecated in all but name. Its release date is 2026-09-21 and the card’s is 2026-10-26, so the base is five weeks older. A checkpoint superseded by its own abliterated build is a plausible thing to let degrade.
The base is simply not what anyone is buying. The card has better latency at every percentile that can be measured and a fraction of the error rate. Teams tried it, saw 60% failures, and moved.
The trend in the daily medians suggests the first two are partly true. The traffic says the third is what matters.
What the card’s 0.938% is worth
Less impressive than it looks, and worth stating.
0.938% is the fourth-highest error rate among the eight abliterated cards, behind GLM 5.3 at 16.110%, Kimi at 1.306% and GLM 5.3 Flash at 0.705% [OURS]. It is not a reliable card in absolute terms; it is a reliable card relative to a base that was failing most of the time.
At ten thousand calls a day, 0.938% is 94 failures. A single retry covers most of them, and at 42.2 tokens a second a retry is slow — a 1,500-token response takes 36 seconds to re-run [OURS, our arithmetic]. So the card’s retry cost is high even though its retry rate is low.
That combination — low rate, slow retry — argues for a client timeout rather than a retry policy, and for a batch queue rather than an interactive path.
What the pair teaches about error rows generally
Four lessons, and they apply across the tier.
An error rate above 50% is an availability fact, not a quality one. No model is wrong six times in ten; the endpoint was down. Read it as an outage and it becomes informative.
Check the traffic before drawing a conclusion. A card with a high error rate and normal traffic is a quality problem. A card with a high error rate and no traffic is an endpoint nobody uses, and the two need different responses.
Look for the cap in the latency rows. A median at exactly the cap is the same signal as a 60% error rate: most requests did not complete.
Compare a card to its base only when the base is healthy. Comparing MiMo’s 0.938% to 60.595% produces a 64.6× multiple that is arithmetically correct and analytically useless, because the denominator is an outage.
What to do with the base
One thing: do not build on it, and say why in the decision record.
The base’s case would be price. At $0.14 in and $0.28 out it is 5.7× cheaper than the card on input and 5.7× on output, with the same window and the same ceiling [OURS]. On a price sheet it is the obvious choice.
Against 60.595% errors it is not a choice at all. A card that fails six requests in ten costs 2.5× what its price suggests in retries alone, before the engineering to handle partial failures — and at a 10,000 ms median there is no partial failure to handle, only requests that never return.
If the base recovers, the calculation changes. Watch its daily series rather than its weekly aggregate, and treat two consecutive days below a two-second median as the signal that it is provisioned again.
The card, priced against the family
At $0.80/$1.60 the card sits at the flash tier’s standard rate, alongside DeepSeek, Qwen, GLM 5.3 Flash and MiniMax [OURS]. It has the highest CyberGym score of any of them at 95.1 and the slowest serving rows at 7,459 ms and 42.2 tokens a second.
So the card’s own case is not its error rate, which is mid-tier. It is a benchmark row — the strongest vulnerability-discovery score in the tier — attached to the weakest latency.
Choosing it means accepting the latency for the discovery quality. Choosing its base means accepting nothing, because the base does not work.
The short version
60.595% on the base against 0.938% on the card is a 64.6× multiple that describes an outage rather than a quality gap. The base’s median sits at the 10,000 ms reporting cap and its traffic is the lowest in the dataset.
The card carries 3.37× the base’s volume — the only pair on the tier where the abliterated build is the busier endpoint — and that is what a working endpoint looks like beside a broken one.
Do not build on the base. Watch its daily series for a recovery, and price the card on its CyberGym 95.1 against a 7,459 ms median, which is the trade it actually offers.
Sourcing note: error rates, latency, daily series, throughput, traffic, prices, context windows and output ceilings are read from both cards’ public model data on 2026-11-15, with seven-day windows ending that day [OURS]. Retry-cost arithmetic is our own. The CyberGym row is OrcaCyber’s own, evaluated 2026-09-20 [VENDOR].